
NJ's Back in Drought

New Jersey had 5 inches of snow last weekend, half an inch of rain this morning, and we’re still in drought warning. The worst drought since..last year.
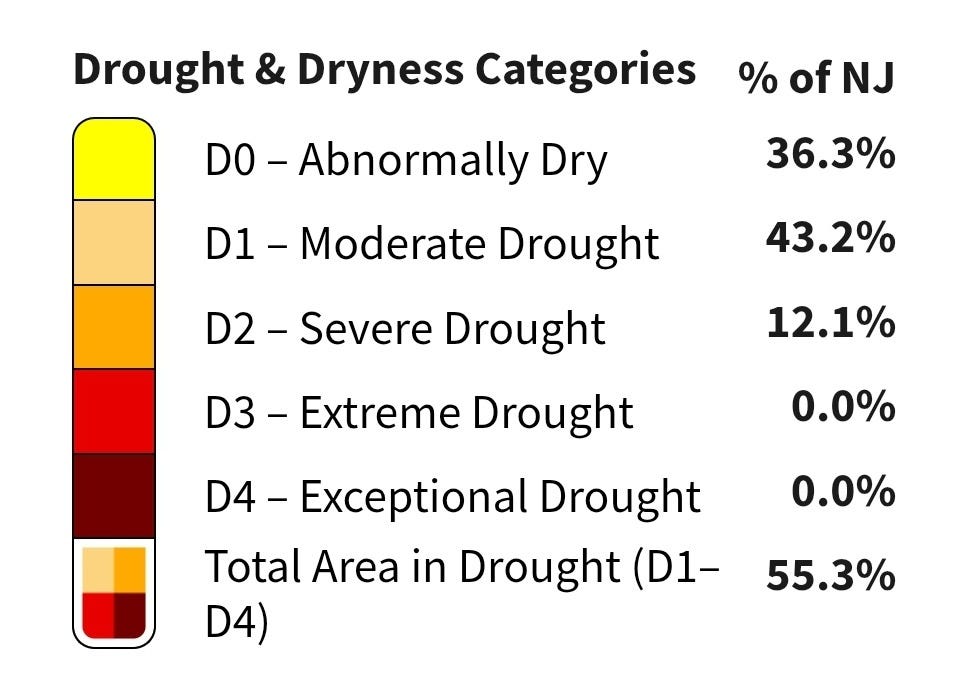
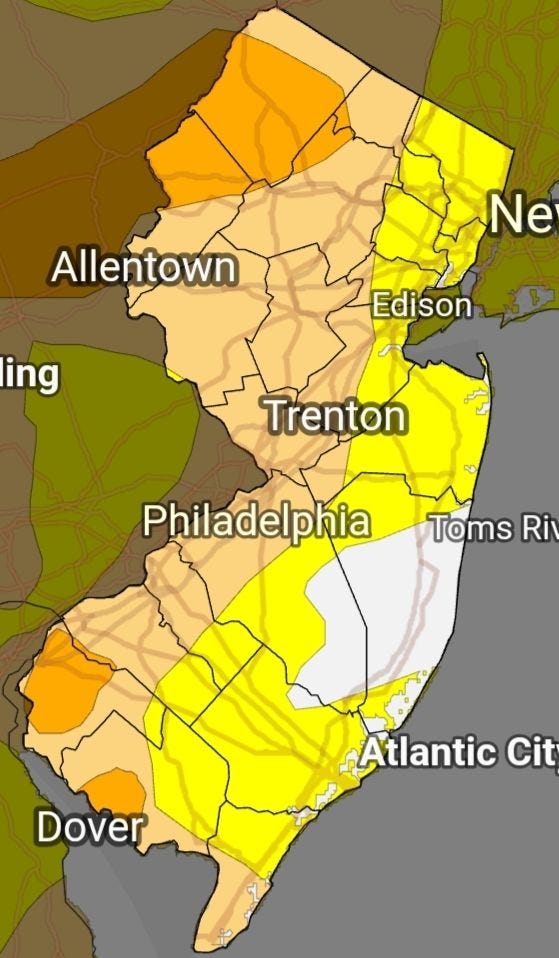
Unfortunately our water levels don’t reset after every drought warning. Meaning that even though we were only placed in drought warning two weeks ago, some regions are already lower than any point during the 11/24 - 06/25 Drought Warning.
Also unfortunately, the effects of drought last long past the warning period. Our last drought warning ended in June, yet our summer had canceled kayak trips and fall saw smaller apples. When 13 of the last 15 months have below-average precipitation, it’s gonna start compounding.
While it sounds scary, it’s only if we don’t stay informed. So let’s get into what the drought levels mean, how drought impacts us here in NJ, and what to expect for our future.
Drought Meanings:
Drought Watch (where we were 10/1/25-12/14/25)
First stage of NJ’s drought system. Called at the first signs of water stress, either too little rain/snow, low rivers or reservoirs, or a combination of the above.
Goal: educate public, encourage voluntary conservation.
Symptoms: Slight decrease in surface water levels, early strain on water systems.
Drought Warning (as of 12/5/25)
What’s happening: Severely decreased stream flows, low groundwater levels, below-normal reservoir storages.
What this means for you:
Water conservation is still voluntary for residents
Water suppliers (your municipality or company like American Water) are actively looking for alternative water sources
Reservoir levels are being managed to protect both people and the environment from severe impacts
Symptoms:
Aquatic life stressed or experiencing die-offs (fish, amphibians)
Trees becoming brittle and more susceptible to disease/pests
Rivers and streams running lower than normal
Private wells potentially showing lower water levels
Landscaping and vegetation looking stressed
Drought Emergency (last occurred 3/2002-1/2003)
What’s happening: Residents are required to conserve water. This is mandatory, not voluntary.
Phase 1 – Available Supply Below Normal
Voluntary conservation urged
Possible bans on adjustable water uses: lawn watering, car washing, fire-hydrant testing, outdoor recreation water use
Phase 2 – Substantial Threat to Public Health & Welfare
Residential water rationing: 50 gallons per person per day (normal is 80-100 gpd)
Nonresidential users face emergency rate schedules to discourage use
Restrictions on outdoor water use are now mandatory
Phase 3 – Further Rationing Required
Rationing deepens
Selective curtailment of industrial users (factories, large water consumers prioritized differently)
Phase 4 – Disaster
Public health and safety cannot be guaranteed
Water quality becomes a major concern
Health facility maintenance is emergency-only
Industrial uses further curtailed; selective business closures occur
Water service interruptions may be necessary
Symptoms at this level: Boil water advisories, restrictions on essential services, potential public health crises.
..But It Just Snowed
Our recent snow doesn’t fix our drought for the same reason a small cup of orange juice doesn’t fully hydrate you after days of nothing to drink.
While it helps start the rehydration process, it’s not enough to get you back to baseline. And while orange juice is great for you, it makes your body work harder to filter the water out.
Similarly, snow is wonderful for delayed hydration, and is important for NJ spring water levels, but it takes longer for the water to be absorbed into the environment. We’re currently 6-8 inches below where we should be for the year, and our 5 inches of snow gave us .5 inches of water.
So while our most recent snow storm was sorely needed (and the most snow some areas have seen in 4 years), we’re gonna need a lot more to get back to where we should be.
Climate Context
So why are we 6-8 inches below normal, with 13 of the past 15 months having less precipitation than we’re supposed to, 10/24 was the driest month on record, and 2024 was the second hottest year in NJ's record (the hottest being 2012)?
Maybe you know the answer is climate change, but you don’t know why. Let’s break it down:
For every 1.8 degree increase in temperature, our atmosphere is able to hold 7% more precipitation. NJ has warmed about 4 degrees compared to the global average of 2. That’s 15% more precipitation in the atmosphere.
Think of a sponge. When it gets full enough, water just starts seeping out. This is our sky. The moisture builds and builds until it eventually reaches the point that it just leaks out of the sky.
Our warming temperature is essentially buying a bigger sponge. So it’s gonna take longer for the sponge to fill, but when it does its a bigger mess. This is why within just two months: August 2024 brought Morristown 5 inches of rain in 3 days, while in October 2024, the whole state only got 0.01 inches
That same storm caved in a roof in Newark and led to 6 inches of coastal flooding. The problem isn’t just the extreme events. it’s what happens in between. It’s small apples and dry hay and delayed tree plantings and impacted fish spawning, and a myriad of other things.
Eco Connection
North Jersey depends on spring snowmelt to recharge reservoirs that supply the whole year. Without enough winter snow, those reservoirs don’t fill. Summer water pressure drops.
Cold-water streams like the Passaic and Raritan rely on that same snowmelt to stay cool enough for trout. When it doesn’t come, water temperatures rise, habitat shrinks, spawning seasons get disrupted. Beginning of ecosystem collapse.
South Jersey’s high groundwater levels sustain everything from cranberry bogs to the rivers where people kayak.
When the water table drops, farmers can’t flood their bogs for harvest season. But it’s not just farms—the rivers and waterways shallow out. Kayak trips get cancelled.
Wetlands that normally filter groundwater and maintain fish and bird habitat can’t do their job. Water quality suffers. Spawning seasons get disrupted. The ecosystem unravels.
Both cascades are happening simultaneously. But when we understand what’s breaking, we know what to fix.
Water Conservation: Big Picture
Check for leaks: Can diagnose yourself, but repairs range from $50-$1,000+.
Upgrade showerheads: $15-40, takes 10 minutes, saves 6,000-7,700 gallons/year.
Replace old toilets: $100-500, saves 18,000-25,000 gallons/year.
If all 3.5 million NJ households did all three: 187 million gallons saved per day, 68 billion gallons per year.
Here’s what’s happening simultaneously:
Household level: If all 3.5 million NJ households did all three things, we’d save 187 million gallons daily. That matters. Do it if you can.
Industrial level: New Jersey has over 70 data centers. By 2030 that could double. Meanwhile each data center consumes an average of 3-5 million gallons per day. One facility equals what thousands of households conserve in a year.
Both are real.
Both need attention.
But they’re different kinds of problems.
Your personal conservation is your part. But data center expansion is decided in town halls and state legislature.
That’s where you actually have leverage: planning board meetings, municipal water agreements, state water policy hearings. That’s where systemic change happens.
So what happens when you understand the scale? When you know one data center uses what thousands of households conserve annually? When you know where the leverage actually is?
I think you act differently. You ask different questions. You show up when you would’ve stayed home.
So here’s my challenge: pick one. Attend a planning board meeting. Find out who’s voting on data center proposals. One action. This week. What will you choose?
Sources:
https://droughtmonitor.unl.edu/CurrentMap/StateDroughtMonitor.aspx?NJ
https://droughtmonitor.unl.edu/DmData/StateImpacts.aspx
https://njclimateresourcecenter.rutgers.edu/resources/state-of-the-climate-new-jersey/
https://njclimateresourcecenter.rutgers.edu/wp-content/uploads/2025/08/State-of-the-Climate-2024.pdf
https://dep.nj.gov/newsrel/25_0054/
https://dep.nj.gov/wp-content/uploads/drought/docs/ao2025-18.pdf
https://njclimateresourcecenter.rutgers.edu/projects/drought-indicators/
https://salem.njaes.rutgers.edu/2025/06/19/whats-the-deal-with-the-drought/